The „Dry Run“ Page provided as first and only prediction value the interest at the beginning of your investment. To show where the strength of AI is located additional prediction values are provided now!
The values are calculated based on the public loans provided by Bondora in the past. So the prediction values are showing, how your Portfolio would have been performed in the past! If the future looks brighter, darker or stays the same the values will differ!
How ist this working
I‘m playing Games, 100 times! In each Game I pick 200 loans randomly out of the Bondora Public Loans according to your risk curve. Then I pick 200 loans with the AI according to your risk and AI curve. Afterwards I calculate the prediction values according to the Game picks. For Random and AI strategy I calculate:
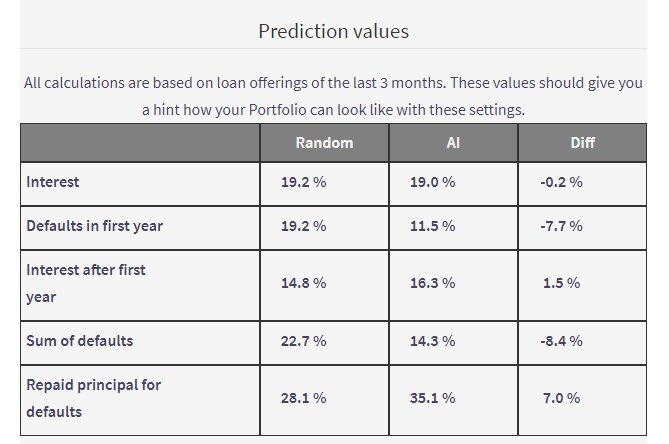
- Interest
- Defaults in the first year
- Interest after first year (Defaults are taken into account)
- Defaults total (so far till today!)
- Remaining Principal of all Defaults
What are the results showing?
The AI doesn’t provide you a higher interest. Unfortunately also no significant lower one.
The AI lowers your defaults. That‘s the point. Due to careful selection the default rate goes down. This depends also on your risk curve. In the conservative area defaults are already low, nevertheless AI performs still some percentage better. For the aggressive risk curve calculation the difference of defaults between Random and AI is (for now!) > 10 %.
Due to better selection more principal is repaid for defaulted loans. Nice to see in the calculation, that besides less defaults are occurring, also more principal is repaid for the AI selections.
Why is it taking so long?
Due to the Game plays described above you need some patience to receive the results. As reward you‘ll receive a real time calculation of the values based on real loans.
Same Settings, different result?
Yep, that‘s possible and is high likely the case. As said I‘m playing the Games in real time with random selections. But from my experience the calculated results are looking quite stable and are showing you the right direction. I’ve observed bigger differences e.g. when calculating Default recovery for Conservative risk curve. For me this is logic because there are less defaults in conservative Ratings so statistically I’ve lesser data and some „extraordinary“ loan picks can change the result. Same can happen in real life!