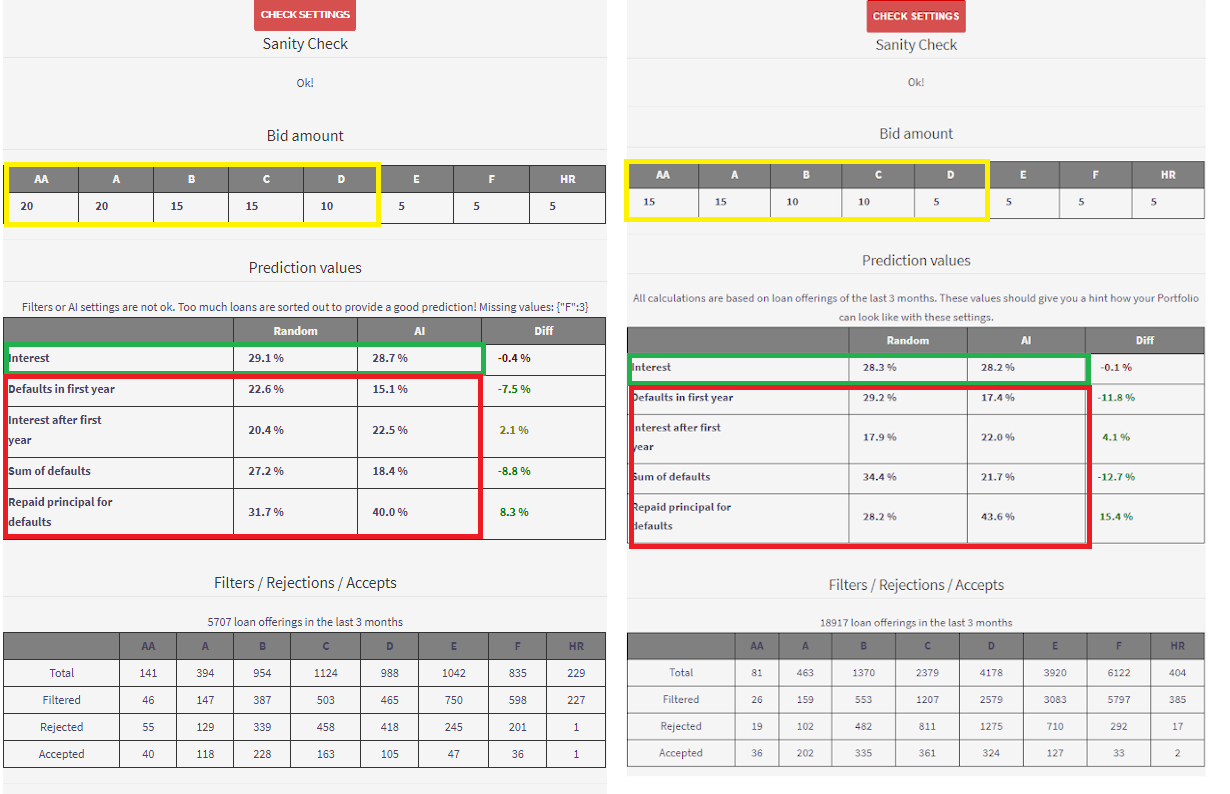
July 2018 I published my personal AI prediction. Now it’s time to compare the prediction with the actual one and make a comparison
Yellow
I lowered the minimum investment in lower risk loans in order to reach a higher diversification
Green
The nominal interest rate is approx. 1% lower. Nevertheless my risk settings didn’t changed but that’s the change after one year!
Red
The default prediction changed quite intense! If loans are picked randomly, like I expectd from Portfolio Manager and Portfolio Pro from Bondoras Auto Invest, the defult raised by nearly 7%. Therefore with the AI selection a moderate raise by 2% – 3% can be observed. So it’s quite useful to check your Portfolio Settings in order to verify your expectations with the Prediction.
Why does the prediction shows more defaults?
The AI is calculated onto Bondoras public loans within a 3 year timeframe. Let’s take the prediction from July 2018 – all public loans from July 1 2014 till June 30. 2017 are taken into account. Now change to the default statistics and check the values: from 2014 to 2017 you will observe a constant raise of default rates in all risk classes. But only half of the year 2017 is taken into account.
The prediction from today – all loans from Sep. 1. 2015 till Aug. 31 2018 are taken into account. From perspective of defaults the “good year 2014” dropped out of the timeframe and the “whole bad year 2017” moved into the timeframe.
tl;dr
It’s pretty nomral that the prediction changes during the time, because the datapool for calculating the AI is adapting according to the actual loans!


